
#Why is web performance important?
Like in the field of communication, the most important part is the message. Your message has to be clear and of interest if you want someone to listen to it. Still, no matter how good your message is, if your channel of communication is lacking or broken, your listener may be tempted to give up on you and start listening to someone else’s rants. And because we’re speaking about performance over here, imagine yourself in a discussion where each reply you get is delayed by a few hefty seconds. Not very pleasant, is it?
Exactly the same thing happens when someone visits your website and has to wait countable seconds for the whole page to load. People don’t want to wait. If Google’s website loads in under a second, they will expect yours to do that too. And if it doesn’t, they’re going to look somewhere else. The standards for what people would call a decent web experience have skyrocketed in the last few years with the dawn of broadband and LTE, but most of today’s websites have either stagnated or slowed down.
This is not just something I’m experiencing because of my ever-lagging browser, as other people are experiencing it too. I have been talking about the current state of the web in a previous editorial which also covers the aspect of performance.
In order to illustrate just how frustrating this web performance problem is, we’ll look at two examples. The first one is Google whose push towards continuously improving speeds is definitely not baseless. A few years ago, they did a study and noticed how only 400ms of lag on their results page would decrease the number of searches by 8,000,000 per day. Then comes Amazon who translates 1 second of page delay to $1,600,000,000 of losses per year. You can find some more examples in this pretty infographic which deals with impatience.
Then comes Amazon who translates 1 second of page delay to $1,600,000,000 of losses per year
Slow page load may be a bad experience for desktop or laptop users, but they’re a bit more forgiving. Mobile users, on the other hand, are quite the opposite. With the appearance of fluid, simple, and ad-free apps for about any single service you can imagine, they won’t struggle to use your website unless it’s good and fast enough. Put yourself in the shoes of a mobile visitor to your website, and ask yourself what advantages you have over the beautifully designed Pocket or Play Newsstand.
I believe that in the interest of your readers, delivering the best possible experience is a good enough reason to consider speeding it up, but just in case it isn’t, here’s another implication to consider. Google awards faster websites with better ranking. And for good reasons too, because that’s exactly what people want.
#Measuring performance
Before starting any web performance tuning, we’ll do some measurements to find out exactly how optimally your site behaves.
#Response time
In order to do a comprehensive analysis of a website’s speed, you need to be able to see how well your server is performing. In the case of WordPress, this is the PHP code that runs the core, plugins, and the theme’s templates. The way you can approximate this is by measuring the time it takes for the website to start transferring the HTML page back to you after your request has been made.
The response time is essential in a website’s performance review because the user will be unable to see anything in the page sooner than this. You can treat this as the latency of your website: no content starts showing up until this is done.
The metric can vary greatly, though. The more people that are on your website, the more load your server will have. The more load your server has, the more time it will take for it to give you back the web page. Other factors can also increase the response time like poor server configuration, a bad connection, unoptimized code, great amount of SQL queries, useless services running on the same server as the website, and a lot more.
The more people that are on your website, the more load your server will have. The more load your server has, the more time it will take for it to give you back the web page.
There are multiple ways of measuring the response time, but there is no best one. The next paragraphs will speak about two of these methods in detail. You should take into consideration that each of them start the request from a specific place in the world, and your website may be optimized for a totally different one. If you’re aiming for a more generic audience, you shouldn’t worry about it too much, though.
Webpagetest
Webpagetest is a free website that you can use in order to measure more than just response time, but it will serve this purpose just as adequately.
In order to start the test, insert your website’s full URL (including the subdomain e.g. www if you’re using one), and choose a server from list that best reflects your audience’s location. First view is what it measures by loading your website for the first time and this is what we’re after. Open up the waterfall view and put down the duration of the first request, i.e. the one on your website’s root URL.
To get a meaningful result, you should repeat this test a few times and average out the results. Maybe even try different relevant locations at different times to make sure that the test server’s network is not clogged up.
Chrome
A similar way of measuring the response time is by using Chrome and your local connection. This is, of course, not as accurate as using a professional website whose purpose is web performance measuring, but it can work pretty well on a good connection, and it’s usually faster.
You can try this out by navigating to your URL and hitting Ctrl-Shift-I or Cmd-Opt-I which opens up Chrome’s DevTools. From here, go to the Network tab and hit refresh. You should get a similar waterfall graph like in the previous example and, again, only the first request matters.

Make sure you take the average from the from multiple tests in order to get decent results.
Example
Let’s see this in action. For this test we picked androidpolice.com and cultofmac.com which is also one of our customers. The locations we used for this test are San Francisco, New York City, and Geneva from the Webpagetest list of servers. After multiple tests from each location on each website, these are the response times that we got:
- San Francisco
- New York City
- Geneva
- San Francisco
- New York City
- Geneva
- androidpolice.com
- cultofmac.com
#Full load
Something very important and definitely something that your users will notice is the full load time. In other words, the time it takes for the browser to come to a stand still after it starts loading your website. This very metric is influenced by both the server side, whose response time is added here, and by the client side, which usually takes the bigger part of the whole pie.
This metric can show you if your assets are too big, if you’re using too many requests, if your scripts are too complex and slow to load etc. Sites that load tons of content in temporally separated batches will definitely trigger an alarm here.
Measuring this is very similar to the response time. You can use Webpagetest or Chrome, but this time you’re interested in the whole load time. And don’t forget to do an average.
#Response time vs full load time
Make sure know the difference between the two terms. The response time will measure the time it takes for the server to respond and the full load time is the time it takes for the page to be fully loaded.
#Number of requests
Making a lot of requests when loading your page will certainly slow it down, and this will translate to large load times. Still, if you want to see how many requests your page tries to make and get a very detailed description of them so as to help you see where you can improve, use can use httparchive.
#Heavy load
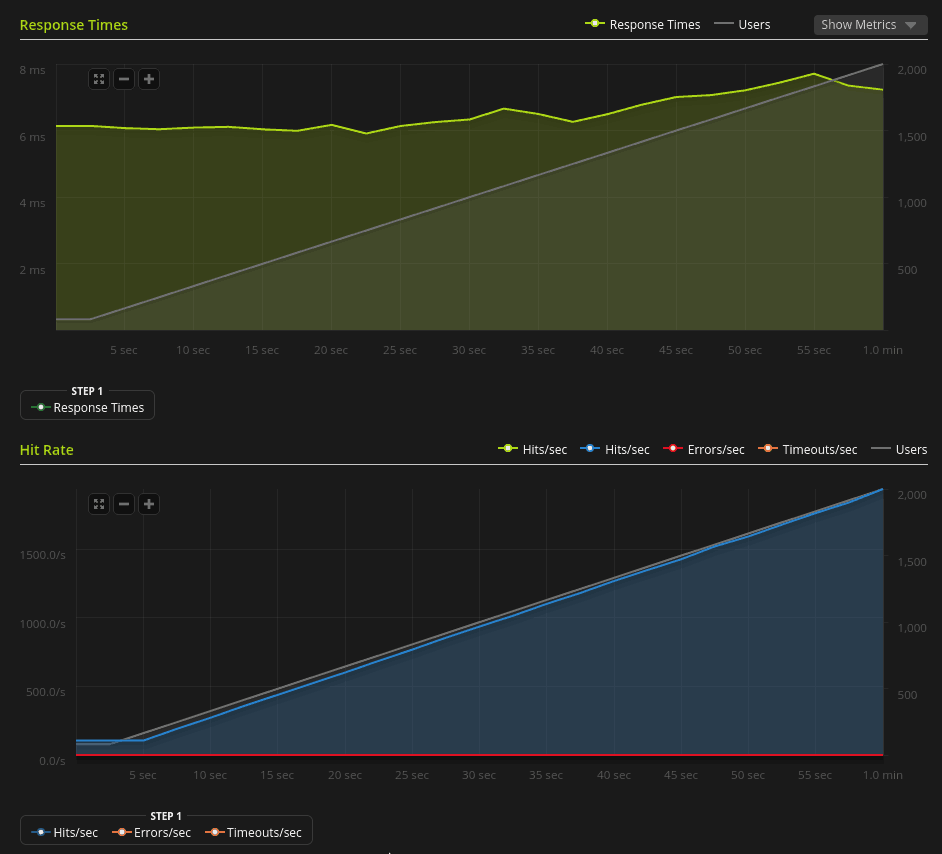
In case you’re worried about higher traffic spikes, you can try tools like loader and Blitz. They provide you with useful data when there are thousands of concurrent visitors on your website.
Below you can find a screenshot of a Blitz rush test of 2000 concurrent users on presslabs.com. As you can see in the graphs, the idea is to have constant response time, irrespective of the amount of users on your website. Also, the number of errors should be ideally 0.
#What to do with all these numbers
You’ve got your values, and now you don’t know how to use them. A pretty good idea would be to try a handful of other websites and see how they fare. Bigger numbers are always worse–we’re interested in making everything as small as possible.
For a WordPress blog, a response time of 500 ms or lower is acceptable, but it can go way better than that. Anything bigger and your readers will stare at a white page that is noticeable and frustrating.
The full load time is a bit harder to pin down. If it’s bigger than 20 s, most of the users will start to think that your website will never finish loading. The key here is to try to fill up the screen and make the website usable in 2 s or less, even if the whole page will take much longer to load.
Last but not least, the number of requests should be around 50, even if your website uses a lot of images. If you make over 200 requests for a single page, though, you can be sure there’s room for improvement.
#Ads
Before finishing this first part of the article and moving on to the web performance tips, let’s first consider the subject of ads. Apart from the fact that ads may very well be the least appreciated part of your website, they also slow your website down since they require separate slow requests.
In order not to have a very slow website, the number of ads on your website should be reasonable. Ads generate income, though, and there’s a lot of them that are actually relevant to users, so we’ll see how we can improve this facet up next.
For some tips and ideas on how to improve the performance of your freshly measured website, head over to our blog next week for the next part of the article.
