
That time of the year when showing some muscle fiber in the WordPress hosting world has finally come. We’re talking about Kevin Ohashi’s yearly effort to look under the hood of managed WordPress hosting platforms and rank us. For Presslabs, it’s way too fun to miss this yearly challenge. It feels like car racing; you’re revving a bit and then competing for that one mile. This year’s results are here and we’re uber happy to see that our WordPress hosting “engine” has gained the top tier appreciation. Hooray!
We really appreciate that the managed WordPress hosting providers are sorted by pricing plans—it’s fairer and brings relevant data to the table. This is the first year when we’ve competed in the Enterprise WordPress hosting category. Besides being terribly challenging, the most important thing is that we’ve got lots of ideas on how to improve our product’s performance. Double win!
We decided not to pay for a re-test and go with the results, first-hand and all-in, so to speak. The randomness of the test moment is entertaining as well when the monitoring thresholds rise and notify us that Kevin from ReviewSignal is ringing the “doorbell”.
Load testing is not necessarily an accurate way of simulating real-life events, but it still represents a good starting point for evaluating the performance and reliability of a service. And in the end, the numbers actually do matter.
First off, we’d like to take a moment to offer some pieces of advice for improving the testing process and also the results of the presentation:
- add the test locations on a map, and perhaps create a heatmap, as it would be probably helpful for potential customers looking for the best option around for their readers’ location
- analyze CDN uptime as well. Taken for granted, the CDN or “commodity delivery network” we could joke, but it might show interesting stuff
- use tools that generate non-uniform load patterns, like locust.io. It’s not our fancy project, although we are heavy Python users at Presslabs (Google mentions it, too)
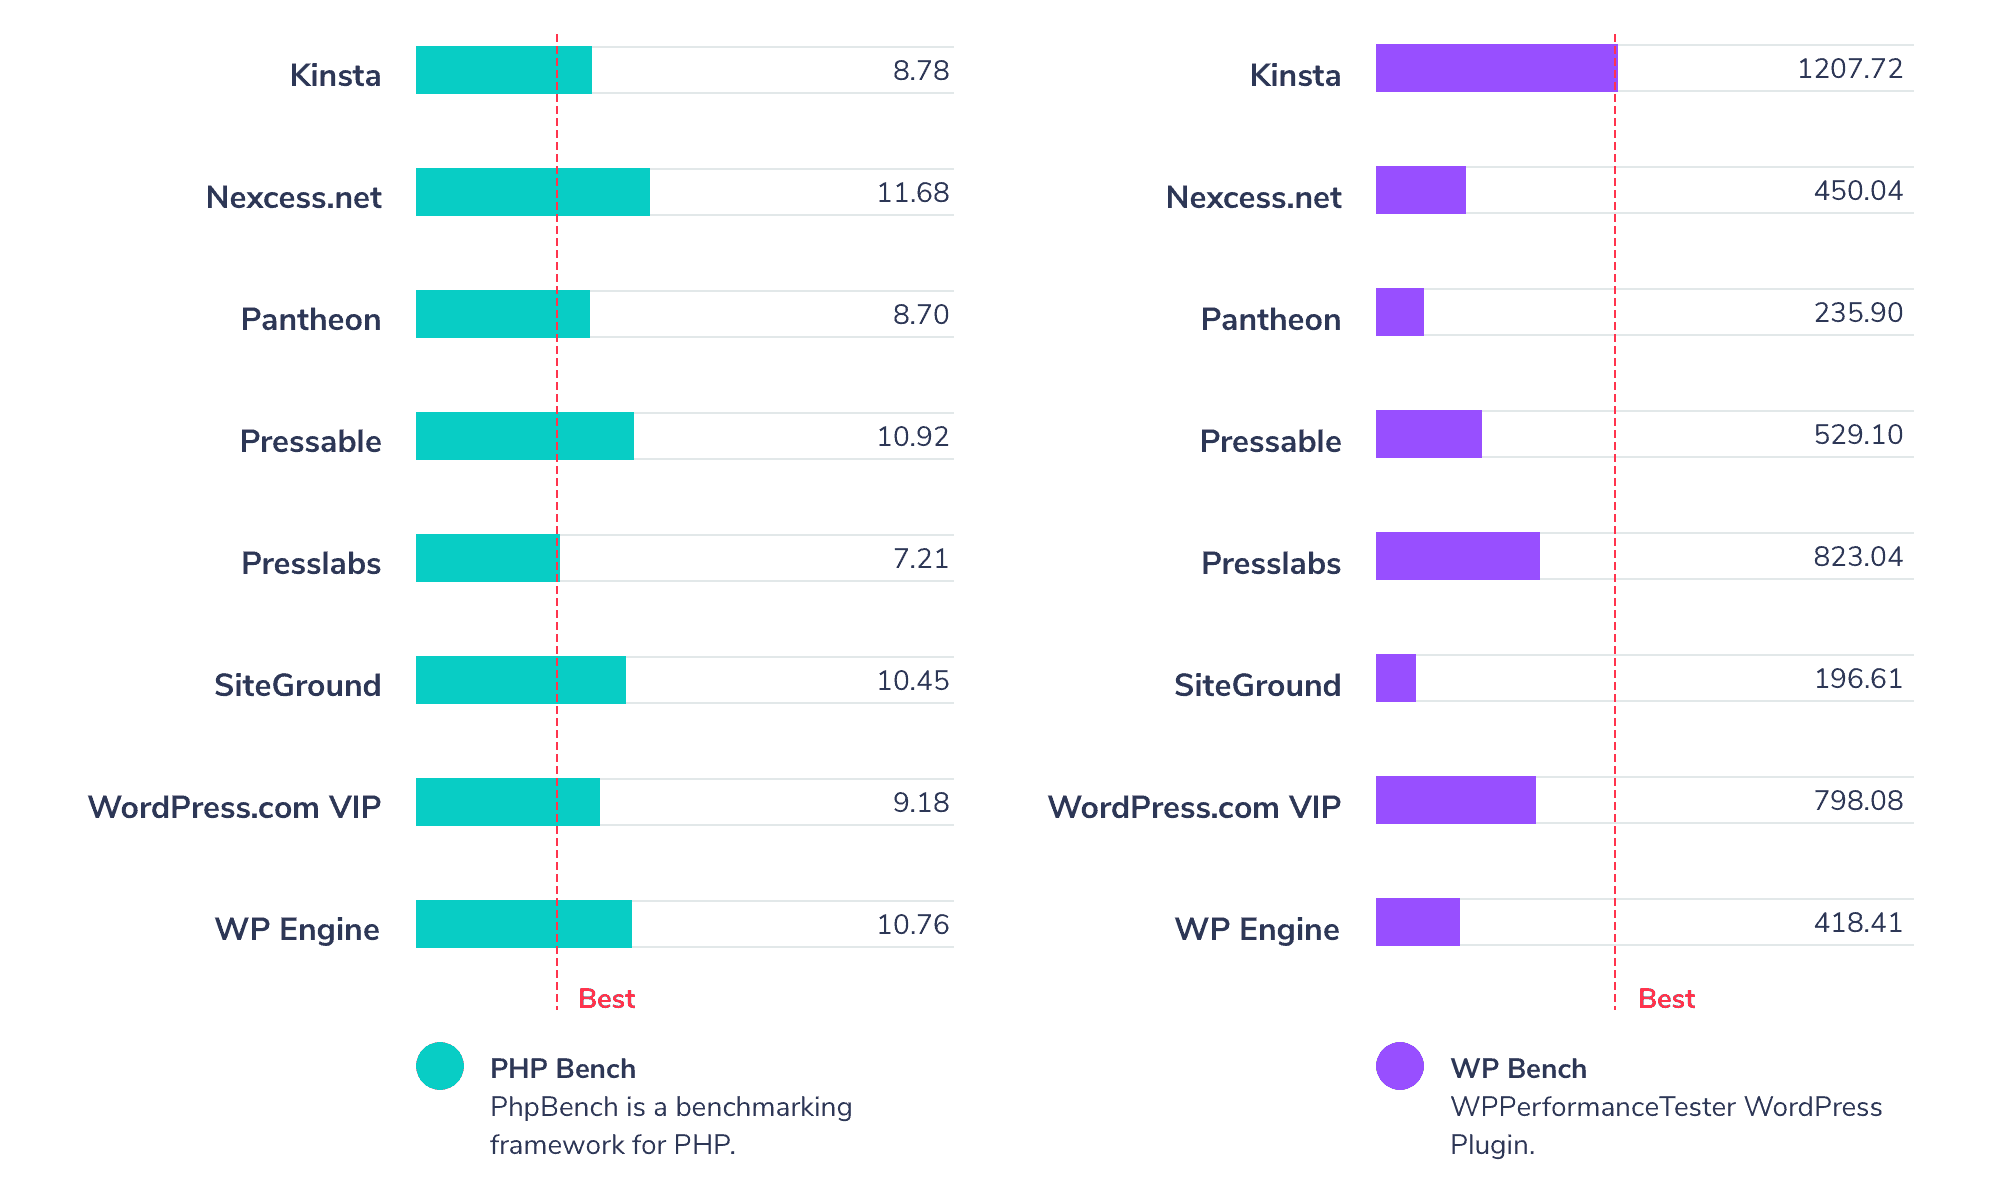
- graph them, as it’s easier to grasp them. We’re preaching for some time about the value of metrics shown up to webmasters, and this is missing now in our eye. We’ve drawn a sample on how we would see a graph:

So here are the numbers for us, as presented on this year’s managed WordPress hosting performance review by Review Signal:
#Logged-in User Testing
This test has been performed using LoadStorm, from 500 to 10,000 users over 30 minutes with 10 minutes at the peak.
| Total Requests | 2012822 |
|---|---|
| Total Errors | 56 |
| Peak requests per second | 1576.23 |
| Average requests per second | 1118.23 |
| Peak response time | 10099 ms |
| Average response time | 208 ms |
| Total Data Transferred | 116.54 GB |
| Peak Throughput | 90.85 MB/s |
| Average Throughput | 64.75 MB/s |
#
#Non-logged User Testing
Performed with LoadImpact, where the test scaled from 1 to 5000 users for 15 minutes.
| Requests | 1991403 |
|---|---|
| Errors | 0 |
| Data transferred | 104.96 GB |
| Peak average load time | 184 ms |
| Peak average bandwidth | 1,980 Mbps |
| Peak average requests per second | 4,580 |
#
#Uptime Monitoring
It’s been evaluated using third-party services UptimeRobot and StatusCake. We are also relying internally on StatusCake for all our monitoring needs.
| UptimeRobot | 100% |
|---|---|
| StatusCake | 100% |
#
#Page Load Testing
WebPageTest has been used to test this metric from selected locations.
| Dulles | 378 ms |
|---|---|
| Denver | 1,352 ms |
| LA | 850 ms |
| London | 490 ms |
| Frankfurt | 381 ms |
| Rose Hill, Mauritius | 1,335 ms |
| Singapore | 485 ms |
| Mumbai | 721 ms |
| Japan | 660 ms |
| Sydney | 551 ms |
| Brazil | 1,336 ms |
| Average | 780 ms |
#
#WPPerformanceTester Grades
Grading of PHP-only and WordPress operations using $wpdb, performed using Kevin’s own open-source plugin.
| PHP Bench | 7.215 |
|---|---|
| WP Bench | 823.0452675 |
#
#SSL Grade
Tested using Qualys’ online tool.
| Report Grade | A+ |
|---|
All in all, thank you for the insights, Kevin!
This is how we’ve seen your work, hope you enjoyed it at least as much as these fine gentlemen did:

